How Loss Aversion and the Sequence of Returns Impact Investors
The S&P 500 index recently closed above 5,000 and set a new all-time high, less than three years after it first crossed the 4,000 mark. While some are understandably nervous any time the market is near record levels, investors also tend to grow more bullish as the momentum continues. Across market cycles, fear often turns into caution, giving way to optimism and eventually irrational exuberance. With the market’s rapid climb over the past year, managing risk is of extreme importance. What should investors keep in mind to stay disciplined and Focused on their financial plans?
Much larger percentage gains are needed to offset losses.
Breakeven Returns
The percentage gain required to offset a percentage loss

Latest data point is February 21, 2024
Source: Standard & Poor’s, LSEG, Clearnomics
For some investors, it may increasingly feel as if the market can only go up despite ongoing financial and economic uncertainty. The bear market of 2022 may even seem like a distant memory now that the Fed is expected to cut rates and inflation has fallen to more manageable levels. While structuring portfolios to benefit from market gains is important, it’s also critical to manage risk. How investors behave when markets are down – even if only for a few days, weeks, or months – can be as important as how they position over years and decades. In this context, there are a few key principles to keep in mind.
First, the way investment returns are calculated can create a daunting situation for investors. This is because positive and negative compound returns are not symmetric – in general, a larger gain is needed to offset a loss. For instance, a 10% decline requires an 11.1% gain to recoup those losses. These differences grow with larger percentages, as shown in the accompanying chart. It’s easy to see that a 50% decline, which cuts the value of a portfolio in half, would require a 100% increase to return to the original value. The effect of losses on compounded returns is sometimes referred to as a “volatility drag.”
Thus, in an inevitable market pullback, it can be easy to become discouraged by the magnitude of the gain needed to return to par. However, history shows that markets have rebounded over time, even when the S&P 500 declines nearly 50% as it did in 2008 or 34% as it did in 2020, making up for these losses on their way to new all-time highs. Of course, the timing of these rebounds is difficult if not impossible to predict. Thus, it’s important to stay invested and not focus on the magnitude of gains and losses.
Having a smoother ride can help investors stick to their long-term plans.
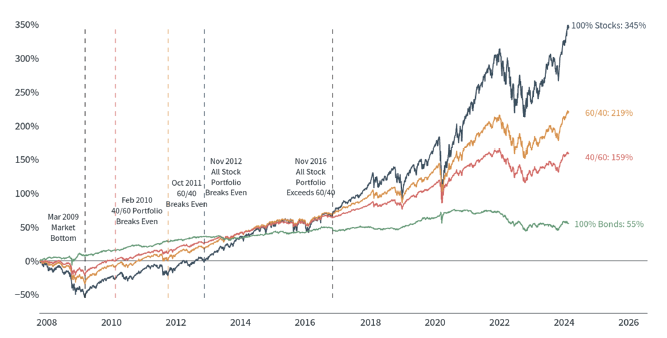
Asset Allocation Performance
Total returns of hypothetical stock/bond portfolios since 2007 pre-financial crisis peak using the S&P 500 and iShares Core U.S. Bond indices

Latest data point is February 21, 2024
Source: Standard & Poor’s, LSEG, Clearnomics
Second, one of the most important ideas in behavioral finance is known as “loss aversion,” the idea that losses tend to feel worse to investors than similar gains. A simple example is that finding fifty dollars on the ground will certainly make you happy but accidentally losing a fifty-dollar bill – or having it stolen from you – will likely make you more upset. This asymmetry in how we experience gains and losses grows as the amount increases. In the extreme, large portfolio gains may make investors quite happy for a short time but large losses may lead investors to give up on their financial plans altogether.
While most investors would like to generate significant portfolio gains year in and year out, the reality is that markets are inherently volatile. This is why, from a long-term perspective, it is far more important for investors to build a portfolio and financial plan that they can stick with through good and bad times, rather than a portfolio with the best theoretical returns.
The accompanying chart shows four different asset allocation portfolios and highlights how different their paths have been since the 2008 financial crisis. Clearly, an all-stock portfolio would have performed best over the past 15 years. However, few investors can stomach losses on the order of 50% over the course of years. Thus, most investors would have been better served holding a diversified portfolio instead. Not only would their returns have been quite strong over this period, but they would have been more likely to stick to their financial goals despite the many challenges along the way.
How investors react to bull and bear markets can have long-term consequences.
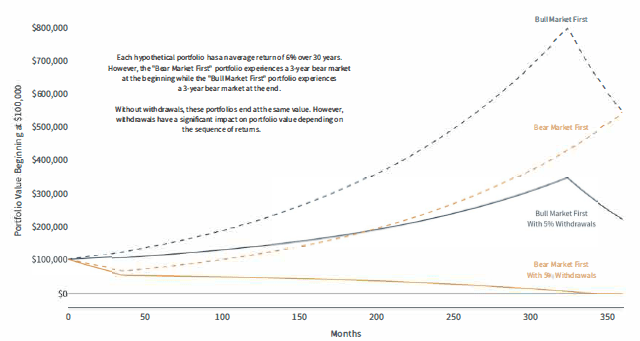
Sequence of Returns Risk
The effect of withdrawals on hypothetical portfolios depending on the sequence of returns

For illustrative purposes only.
Source: Clearnomics
Finally, the idea that the timing of positive and negative returns matters is known as “sequence of returns risk.” In a perfect world, whether an investor experiences a bear market or bull market first would not affect the final outcome, as shown in the dotted lines in the accompanying chart. In reality, however, investors will likely behave differently in bull and bear markets, and they may be withdrawing from their portfolios along the way, creating a drag that is compounded over time. This is yet another reason investors should be careful of making sharp portfolio adjustments during periods of market volatility and should consult with a trusted advisor on portfolio positioning and withdrawals.
While markets have reached new all-time highs, investors should not lose sight of risk management. Properly diversifying allows investors to manage through good times and bad, increasing the odds that they will achieve their long-term financial goals.
Sources: Standard & Poor’s, Bloomberg, U.S. BEA, BCA Research, Ned Davis Research, Clearnomics
The S&P 500® Index, or Standard & Poor’s 500 Index, is a market-capitalization-weighted index of 500 large publicly traded companies in the U.S.
The iShares Core U.S. Aggregate Bond Index seeks to track the investment results of an index composed of the total U.S. investment-grade bond market.
For informational and educational purposes only. Not intended as legal, tax or investment advice or a recommendation of any particular security or strategy. Indices themselves are not investible products. The views and opinions expressed herein, specifically expressions of ··we” or “we feel”, are those of the author(s) and do not necessarily reflect the views of Constellation Wealth Advisors, Quadrant Capital Group LLC, or its affiliates, or its other employees. Past performance is not indicative of future results. Constellation Wealth Advisors, LLC (“‘Constellation”) is a registered investment adviser. Information prepared from third-party sources is believed to be reliable though its accuracy is not guaranteed. Opinions expressed in this commentary reflect subjective judgments based on conditions at the time of writing and are subject to change without notice. For more information about Constellation Wealth Advisors, including the firm’s Form ADV Part 2A Brochure, please visit https://adviserinfo.sec.gov or contact us at 513.871.5500. Copyright le) 2023 Clearnomics, Inc. All rights reserved. The information contained herein has been obtained from sources believed to be reliable but is not necessarily complete and its accuracy cannot be guaranteed. No representation or warranty, express or implied, is made as to the fairness, accuracy, completeness, or correctness of the information and opinions contained herein. The views and the other information provided are subject to change without notice. All reports posted on or via www.clearnomics.com or any affiliated websites, applications, or services are issued without regard to the specific investment objectives, financial situation, or particular needs of any specific recipient and are not to be construed as a solicitation or an offer to buy or sell any securities or related financial instruments. Past performance is not necessarily a guide to future results. Company fundamentals and earnings may be mentioned occasionally but should not be construed as a recommendation to buy, sell, or hold the company’s stock. Predictions, forecasts, and estimates for any and all markets should not be construed as recommendations to buy, sell, or hold any security–including mutual funds, futures contracts, and exchange-traded funds, or any similar instruments. The text, images, and other materials contained or displayed in this report are proprietary to Clearnomics, Inc. and constitute valuable intellectual property. All unauthorized reproduction or other use of material from Clearnomics, Inc. shall be deemed willful infringementls) of this copyright and other proprietary and intellectual property rights, including but not limited to, rights of privacy. Clearnomics, Inc. expressly reserves all rights in connection with its intellectual property, including without limitation the right to block the transfer of its products and services and/or to track usage thereof, through electronic tracking technology, and all other lawful means, now known or hereafter devised. Clearnomics, Inc. reserves the right, without further notice, to pursue to the fullest extent allowed by the law any and all criminal and civil remedies for the violation of its rights.


